COURSE DESCRIPTION
A. Microsoft Power BI 2019

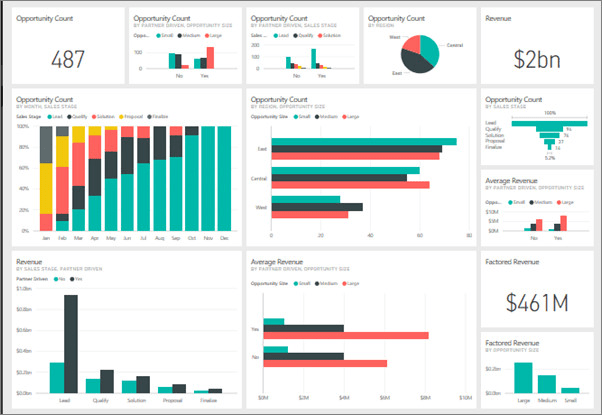
Microsoft Power BI is a collection of tools and services that work together to analyze data and share useful insights about that data(Through Reports and Dashboards). With Power BI, organizations can analyze data from many different applications and share insights from that data in real time across multiple different devices. Power BI makes it easy for you to get your data from any data store, analyze it, derive new knowledge about your organization and share that knowledge easily with the other people who should know about it – whether they are internal or external to your organization.
Microsoft Power BI 2019 Course Outline:
Lesson 1: INTRODUCTION
Lesson 2: GETTING TO KNOW POWER BI
Lesson 3: POWER BI COMPONENTS
Lesson 4: BASIC POWER BI CONCEPTS
Lesson 5: GETTING DATA WITH POWER BI
Lesson 6: CLEANING DATA WITH POWER BI
Lesson 7: EDITING DATA IN POWER BI
Lesson 8: CREATING REPORTS WITH POWER BI
Lesson 9: PUBLISHING REPORTS TO THE POWER BI SERVICE
Lesson 10: SHARING POWER BI REPORTS/DASHBOARDS
Lesson 11: POWER BI GATEWAY
Lesson 12: CONFIGURING DATA ALERTS FOR YOUR REPORTS
Lesson 13: UNDERSTANDING POWER BI APPS
Lesson 14: POWER BI CASE STUDY
Microsoft Power BI 2019 Course : N99,999 ($274), 24PDU
B. Python for Data Science, Analysis & Visualization
Python is a general-purpose coding language—which means that, unlike HTML, CSS, and JavaScript, it can be used for other types of programming and software development besides web development. That includes back end development, software development, data science and writing system scripts among other things.
Python for Data Science, Analysis & Visualization Course Outline:
Lesson 1-Introduction to Python
Lesson 2-Data Ingestion with Python: Learn how to use Python tools and techniques to solve one of the main challenges data scientists face: getting good data to train their algorithms.
Lesson 3-Python Essential: Review the syntax of this simple programming language, and learn how to write scripts, create modules, and integrate a database with Python 3 and the Python database API.
Lesson 4-Python for Data Science Part 1: Learn Python programming for data science. Discover how to clean, transform, analyze, and visualize data, as you build a practical project: an automated web scraper.
Lesson 5-Python for Data Science Part 2: Learn Python programming for data science. Part 2 describes how to use machine learning to generate predictions and recommendations and automate routine tasks.
Lesson 6-Python Scientific Stack: Learn how to use the Python scientific stack to complete data science tasks. Find out how to work with pandas for data crunching, NumPy for numeric computation, and more.
Lesson 7-Python Data Analysis: Interested in using Python for data analysis? Learn how to use Python, NumPy, and pandas together to analyze data sets large and small.
Lesson 8-Python for Data Science Tips, Tricks, & Techniques: Learn 12 techniques for how to work with data using Python. Review how to explore data, ingest data, visualize data, and more.
Lesson 9-Python for Data Visualization: Build accurate, engaging, and easy-to-generate data visualizations using the popular programming language Python.
Lesson 10-Python Statistics Essentials
Python for Data Science, Analysis & Visualization Course : N99,999 ($274), 24PDU
C. Advanced Microsoft Excel 2019
Microsoft Excel is a spreadsheet program included in the Microsoft Office suite of applications. Spreadsheets present tables of values arranged in rows and columns that can be manipulated mathematically using both basic and complex arithmetic operations and functions. In most project oriented environments, data from several Database driven software (such as Oracle Primavera and SAP etc.) are exported, analyzed and reported using Microsoft Excel.
Advanced Microsoft Excel 2019 Course Outline:
Lesson 1: Getting started with Excel 2019
Lesson 2: Working with data and Excel tables
Lesson 3: Performing calculations on data
Lesson 4: Changing workbook appearance
Lesson 5: Focusing on specific data by using filters
Lesson 6: Reordering and summarizing data
Lesson 7: Combining data from multiple sources
Lesson 8: Analyzing data and alternative data sets
Lesson 9: Creating charts and graphics
Lesson 10: Using PivotTables and PivotCharts
Lesson 11: Printing worksheets and charts
Lesson 12: Working with macros and forms
Lesson 13: Working with other Office programs
Lesson 14: Collaborating with colleagues
Advanced Microsoft Excel 2019 Course : N99,999 ($274), 24PDU
Services from Bizville Project Management Limited are:
- Project Management Training
- Strategic PMO Solutions
- Project Handling and Contract
- Property Sales and Construction Supplies
Follow us on Social Media: